Privacy Accuracy Frontier
Given a dataset and a privacy level ε, which algorithm introduces the smallest error?
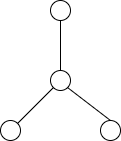
The shape of the subgraph is:

Data point being displayed is algorithm: . Epsilon chosen is